Technology
How Is an Image Created?
Cameras are made up of a vast number of components, but the most vital component is the image sensor which generates the imagery. Image sensors absorb light wavelengths, translate them into energy currents, and then the energy is translated into data. Finally, the data is converted into the image you see on your screen by the camera's interface.
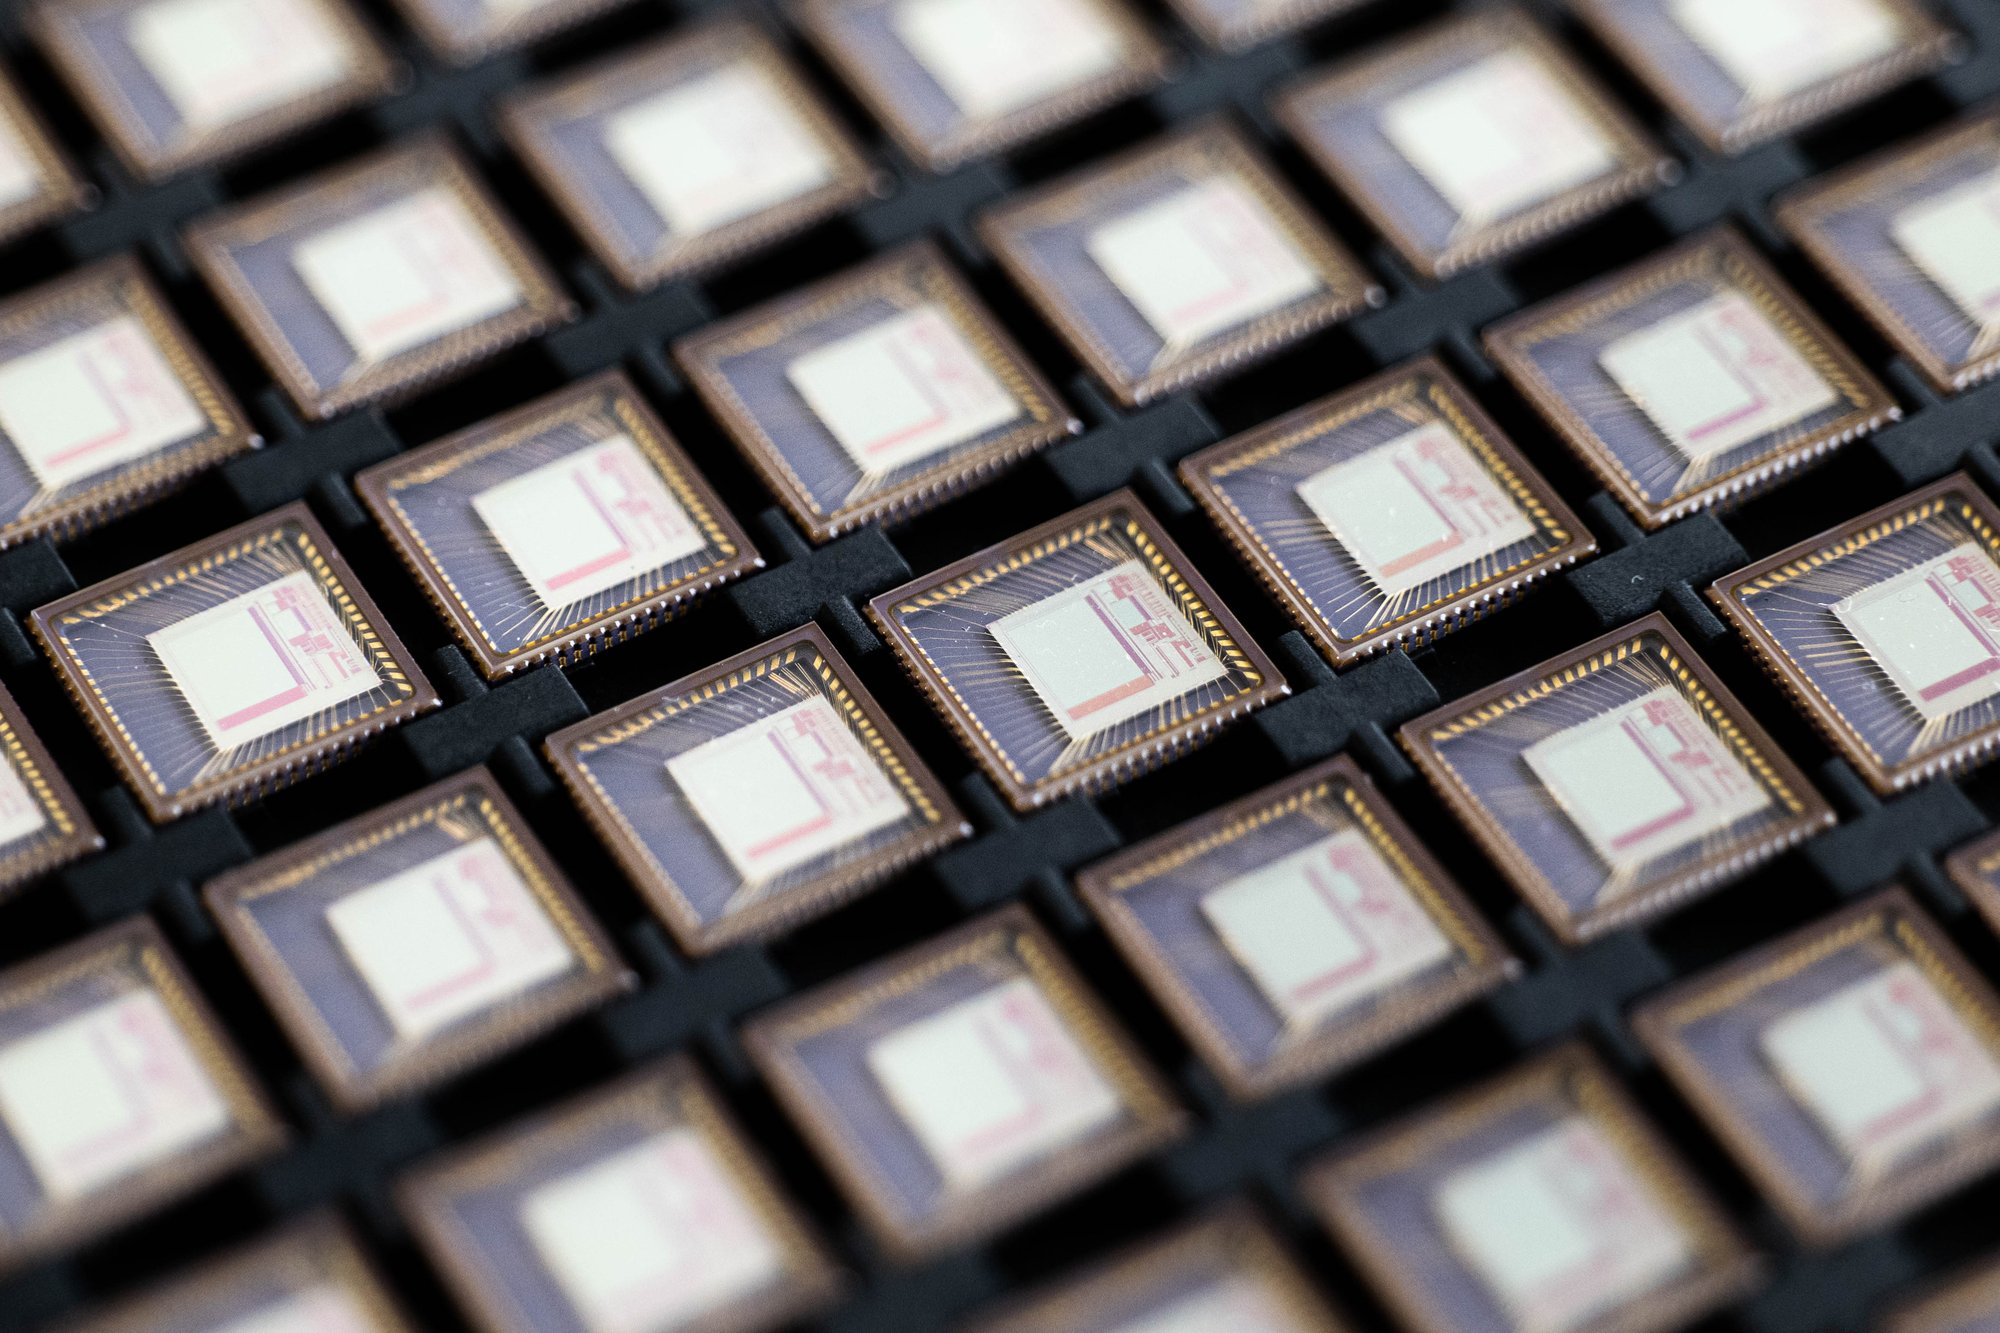
The root of our technology is based in our pixel array made up of individual unit pixels. Our unit pixels can detect any incoming photons to trigger the electrical current, amplifying the output to provide a higher-quality image faster.

Performance
Dynamic Range
Our image sensor can immediately provide higher photocurrent outputs despite any light setting due to the pixel array's unique design. The design allows the sensor to absorb wavelengths from UV to SWIR with decreased noise levels, increasing the sensor's dynamic range and SNR.
Sensitivity
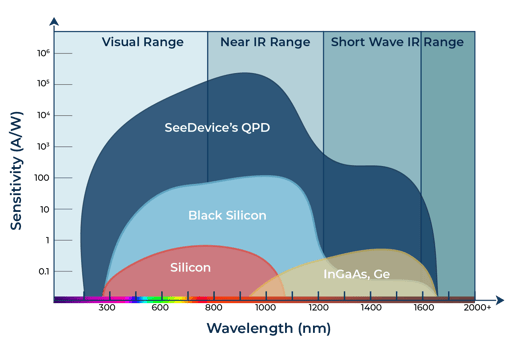
Due to the pixel array's design, the sensor is more sensitive to incoming photons and is able to absorb more light wavelengths. In comparison to exotic materials such as InGaAS and Black Silicon, our sensor's sensitivity remains higher even when venturing further into the light spectrum.

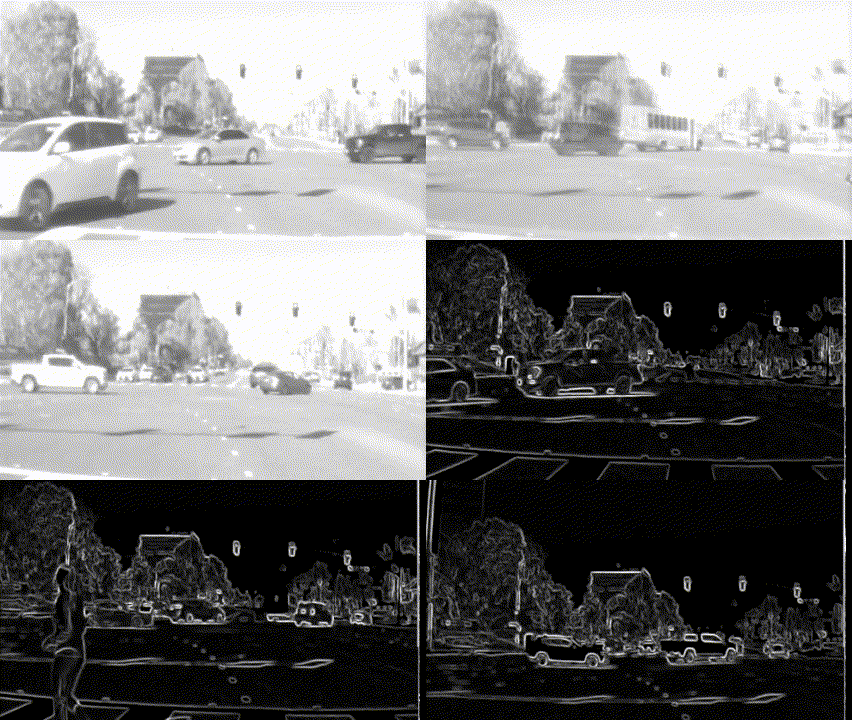
Outdoor driving test demonstrating edge detection and dynamic range.


Spectral Range
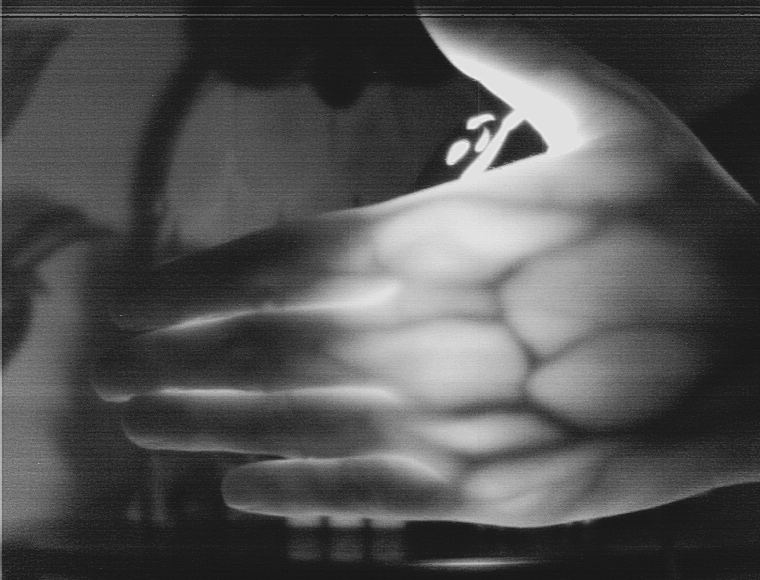
Since the quantum photodetector has a wider spectral range response, spanning from 200-1650nm, it is able to view from UV to the SWIR region of the light spectrum. With most vein imaging products suffering from scattering and low image quality, it decreases the accuracy of the vein reading especially if the user's hand will not remain in place. Coupled with the quantum photodetector's fast integration time, the imager is able to penetrate further into the user's skin and tissue to get a higher matching accuracy especially if the user is consistently moving
Benefits
Improved Integration Time
Vision in any weather/light condition
Higher Quality Visual Data
![]()
Expanded Spectral Range
Reduced Power Consumption
![]()
